-
Prometheus Server:負責採集監控資料,並且對外提供PromQL實現監控資料的查詢以及聚合分析;
-
Exporters:用於向Prometheus Server暴露資料採集的endpoint,Prometheus輪訓這些Exporter採集並且儲存資料;
-
AlertManager以及其它元件(……和本文無關就不說這些)
scrape_configs:
- job_name: prometheus
  metrics_path: /metrics
  scheme: http
  static_configs:
  - targets:
    - localhost:9090


-
只要Exporter在執行,你可以在任何地方(比如在本地),搭建你的監控系統
-
你可以更容器的去定位Instance實體的健康狀態以及故障定位

version: '2'
services:
  consul:
    image: consul
    ports:
      - 8400:8400
      - 8500:8500
      - 8600:53/udp
    command: agent -server -client=0.0.0.0 -dev -node=node0 -bootstrap-expect=1 -data-dir=/tmp/consul
    labels:
      SERVICE_IGNORE: 'true'
  registrator:
    image: gliderlabs/registrator
    depends_on:
      - consul
    volumes:
      - /var/run:/tmp:rw
    command: consul://consul:8500
  prometheus:
    image: quay.io/prometheus/prometheus
    ports:
      - 9090:9090
  node_exporter:
    image: quay.io/prometheus/node-exporter
    pid: "host"
    ports:
      - 9100:9100
  cadvisor:
    image: google/cadvisor:latest
    ports:
      - 8080:8080
    volumes:
      - /:/rootfs:ro
      - /var/run:/var/run:rw
      - /var/lib/docker/:/var/lib/docker:ro

global:
scrape_interval: 5s
scrape_timeout: 5s
evaluation_interval: 15s
scrape_configs:
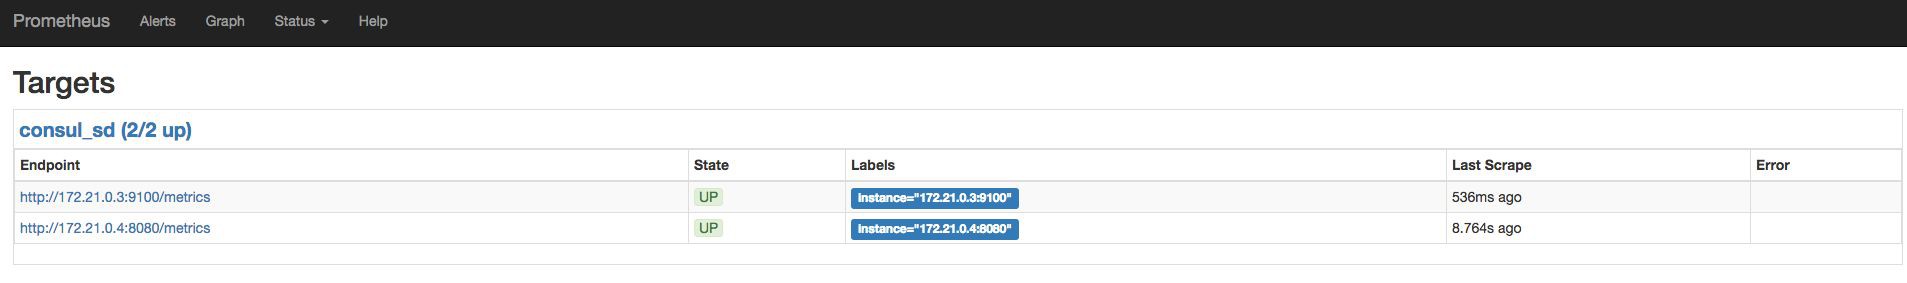
- job_name: consul_sd
metrics_path: /metrics
scheme: http
consul_sd_configs:
- server: consul:8500
scheme: http
services:
- node_exporter
- cadvisor
-
server:指定了Consul的訪問地址
-
services:為註冊到Consul中的實體資訊
services:
  prometheus:
    volumes:
      - ./prometheus/prometheus:/etc/prometheus/prometheus.yml
-
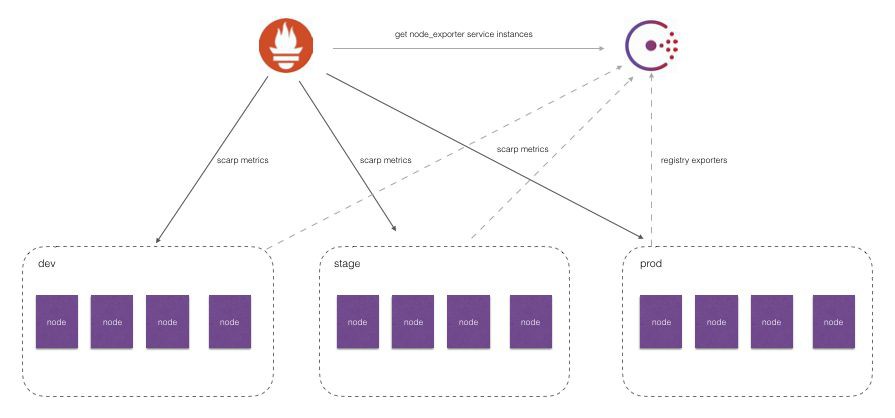
需要按照不同的環境dev、stage、prod聚合監控資料?
-
對於研發團隊而言,我可能只關心dev環境的監控資料?
-
為每一個團隊單獨搭建一個Prometheus Server? 如何讓不同團隊的Prometheus Server採集不同的環境監控資料?
node_cpu{cpu="cpu0",instance="172.21.0.3:9100",job="consul_sd",mode="guest"}
node_cpu{cpu="cpu0",instance="172.21.0.3:9100",dc="dc1",job="consul_sd",mode="guest"}
-
_meta_consul_address:Consul地址
-
_meta_consul_dc:Consul中服務所在的資料中心
-
_meta_consul_ metadata_
:服務的metadata -
_meta_consul_node:服務所在Consul節點的資訊
-
_meta_consul_ service_address:服務訪問地址
-
_meta_consul_ service_id:服務ID
-
_meta_consul_ service_port:服務埠
-
_meta_consul_service:服務名稱
-
_meta_consul_tags:服務包含的標簽資訊

...
scrape_configs:
- job_name: consul_sd
relabel_configs:
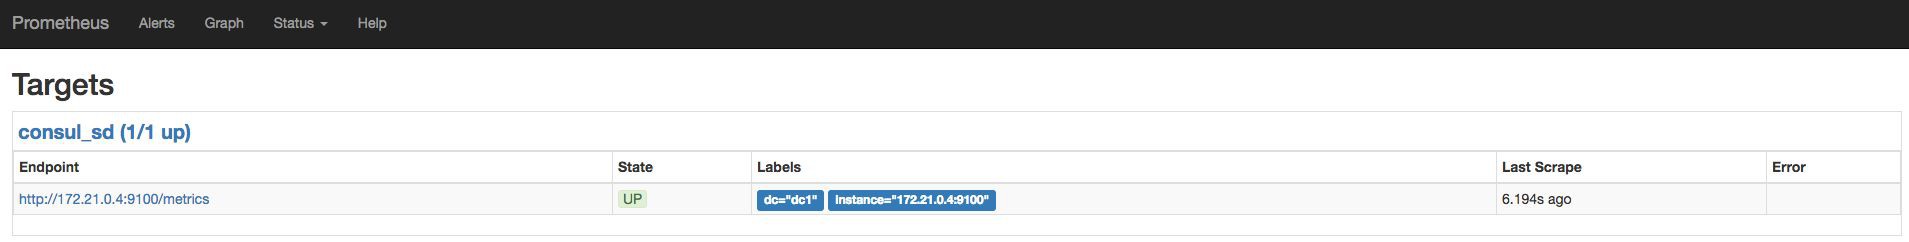
- source_labels: ["__meta_consul_dc"]
regex: "(.*)"
replacement: $1
action: replace
target_label: "dc"
...
target_label: "dc"

node_cpu{cpu="cpu0",dc="dc1",instance="172.21.0.6:9100",job="consul_sd",mode="guest"}    0
node_cpu{cpu="cpu0",dc="dc1",instance="172.21.0.6:9100",job="consul_sd",mode="guest_nice"}    0
node_cpu{cpu="cpu0",dc="dc1",instance="172.21.0.6:9100",job="consul_sd",mode="idle"}    91933.77
node_cpu{cpu="cpu0",dc="dc1",instance="172.21.0.6:9100",job="consul_sd",mode="iowait"}    56.8
node_cpu{cpu="cpu0",dc="dc1",instance="172.21.0.6:9100",job="consul_sd",mode="irq"}    0
node_cpu{cpu="cpu0",dc="dc1",instance="172.21.0.6:9100",job="consul_sd",mode="nice"}    0
node_cpu{cpu="cpu0",dc="dc1",instance="172.21.0.6:9100",job="consul_sd",mode="softirq"}    19.02
    relabel_configs:
    - source_labels: ["__meta_consul_tags"]
      regex: ".*,development,.*"
      action: keep
version: '2'
services:
  consul:
    image: consul
    ports:
      - 8400:8400
      - 8500:8500
      - 8600:53/udp
    command: agent -server -client=0.0.0.0 -dev -node=node0 -bootstrap-expect=1 -data-dir=/tmp/consul
    labels:
      SERVICE_IGNORE: 'true'
  registrator:
    image: gliderlabs/registrator
    depends_on:
      - consul
    volumes:
      - /var/run:/tmp:rw
    command: consul://consul:8500
  prometheus:
    image: quay.io/prometheus/prometheus
    ports:
      - 9090:9090
    volumes:
      - ./prometheus/prometheus.yml:/etc/prometheus/prometheus.yml
  node_exporter:
    image: quay.io/prometheus/node-exporter
    pid: "host"
    ports:
      - 9100:9100
    labels:
      SERVICE_TAGS: "development" # 設定該服務向consul註冊的TAGS為development
  cadvisor:
    image: google/cadvisor:latest
    ports:
      - 8080:8080
    volumes:
      - /:/rootfs:ro
      - /var/run:/var/run:rw
      - /var/lib/docker/:/var/lib/docker:ro
    labels:
      SERVICE_TAGS: "production,scraped" # 設定該服務向consul註冊的TAGS為development,production

-
在雲平臺/容器平臺中我們可以透過Prometheus的SD能力動態發現監控的標的實體
-
透過relabeling可以在寫入metrics資料之前,動態修改metrics的label
-
透過relabeling可以對Target實體進行過濾和選擇